When the Centers for Disease Control and Prevention in 1995 began collecting data on adult obesity in all 50 states, the highest rate was 19%. In 2013, each state had an obesity rate of at least 20%.
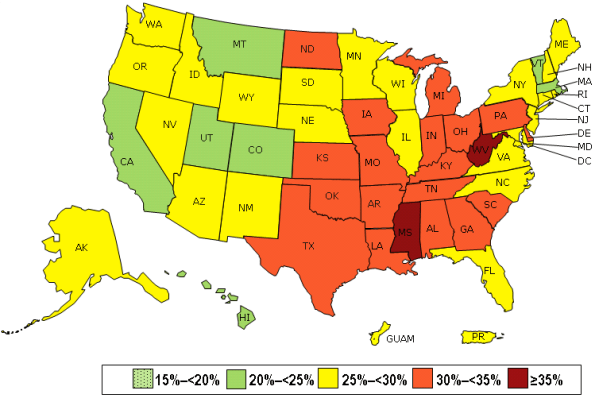
The CDC released a map showing obesity rates state by state.1 The map serves as a springboard to deliver a variety of obesity-related messages, and as a graphic, it paints a bleak picture of the phenomenon across the nation.
Obesity is defined as a body mass index (BMI) of 30 or higher. Conditions that are related to obesity include heart disease, stroke, type 2 diabetes – some of the leading causes of preventable death.2 Apart from the human cost, the dollar figures associated with obesity are staggering: The estimated annual medical cost of obesity in the U.S. was $147 billion in 2008 U.S. dollars, while the medical costs for people who are obese were $1,429 higher than those of normal weight.3
According to data depicted on the obesity map, nearly half (23) of the states had a prevalence of obesity between 25% and <30%, while 18 states had a prevalence of obesity between 30% and <35%. The dubious distinction for the highest rates of adult obesity went to Mississippi (35.1%) and West Virginia (35.1%), while the lowest were in Hawaii (21.8%) and Colorado (21.3%).
By region, the South had the highest prevalence of obesity (30.2%), followed by the Midwest (30.1%), the Northeast (26.5%), and the West (24.9%).
In terms of demographics, obesity is more prevalent in some groups than others: Non-Hispanic blacks have the highest age-adjusted rates of obesity (47.8%) followed by Hispanics (42.5%), non-Hispanic whites (32.6%), and non-Hispanic Asians (10.8%). Other findings are that obesity is higher among middle age adults, 40-59 years old (39.5%) than among younger adults, age 20-39 (30.3%) or adults over 60 or above (35.4%) adults.
The data contained in the report aren’t just signposts that point to Fat City. The CDC and other public health agencies are hoping they serve as a red flag.
As part of an effort to reverse the trend of increasing obesity, the 2014 State Indicator on Physical Activity report, issued by the CDC’s National Center for Chronic Disease Prevention and Health Promotion in August, looks at how states stack up when it comes to physical activity, a major tool in the fight against obesity.4
The report shows that physical activity among adults and high school students varies considerably. Alaska, Colorado and Washington D.C. are the only states or entities to have more than 25 percent of their residents meet the recommended aerobic and muscle strengthening guidelines. At the other end of the list, Mississippi, Tennessee and West Virginia have the smallest percentage of residents who meet those guidelines.
The report also looks at what local government and social services agencies are doing to encourage physical activity, and found that 27 states have adopted policies that formalize their intent to plan, design and maintain streets so they are safe for all users including pedestrians, bicyclists, motorists, transit riders, and those in wheelchairs.
The authors of that report wrote that state health departments can work with governmental and non-governmental partners to create safe places for physical activity, to enhance physical education and physical activity in schools and child care settings, and to support street-scale and community-scale design policy. It’s likely that those partnerships will depend upon the type of activities on which each state focuses. For example, some state departments of health, parks and recreation, and education may work together to help communities establish joint-use agreements that allow residents to use school physical activity facilities after school hours.
Although it didn’t take long for obesity to gain ground over the past decade or so, in fighting the battle of the bulge on a nationwide scale, it could still be a long road ahead.
References
1. http://www.cdc.gov/obesity/data/table-adults.html
2. http://www.nhlbi.nih.gov/health-pro/guidelines/current/obesity-guidelines/full-report.htm
3.
http://content.healthaffairs.org/content/28/5/w822.full.pdf+html
4. www.cdc.gov/physicalactivity/downloads/pa_state_indicator_report_2014.pdf

NFPT Staff Writers contribute in various ways to the NFPT blog